|
Summary
|
|
|
|
|
|
Fund Name
|
HSBC Mutual Fund
|
|
Scheme Name
|
HSBC Flexi Cap Fund-Reg(G)
|
|
AMC
|
HSBC Global Asset Management (India) Private Limited
|
|
Type
|
Open ended scheme
|
|
Category
|
Equity - Flexi Cap Fund
|
|
Launch Date |
24-Feb-04
|
|
Fund Manager
|
Abhishek Gupta
|
|
Face Value
|
10
|
|
Custodian |
HDFC Bank Limited
|
|
Net Assets (Rs. cr)
|
5538.48
|
|
|
|
|
|
AMC Details |
|
HSBC Global Asset Management (India) Private Limited
|
|
9-11 Floors, NESCO IT Park, Building No.3,
|
|
Western Exp Highway, Goregaon (E)
|
|
Mumbai - 400 063
|
|
Phone :
+91 (22) 66145000
|
|
Fax :
+91 (22) 49146033
|
|
investor.line@mutualfunds.hsbc.co.in
|
|
http://www.assetmanagement.hsbc.co.in/
|
|
|
|
Registrar & Transfer Agent Details |
|
Computer Age Management Services Limited
|
|
178 / 10, Kodambakkam High Road,
|
|
Opp. Palmgroove Hotel, M.G.R. Salai, Nungambakkam,
|
|
Chennai - 600 034
|
|
(044) 39115574, 39115583
|
|
(044) 28291521
|
|
camslb@camsonline.com
|
|
www.camsonline.com
|
|
|
|
|
|
|
|
|
|
|
|
|
NAV Details
|
|
|
|
NAV Date
|
23-Jun-26 |
Max Entry Load %
|
0.00 |
|
NAV [Rs] |
225.52 |
Max Exit Load %
|
0.00 |
|
Buy/Resale Price [Rs]
|
225.52 |
52 Week High[Rs] |
227.43 (22-Jun-26) |
|
Sell/Repurchase Price [Rs]
|
225.52 |
52 Week Low[Rs]
|
192.36 (31-Mar-26) |
|
|
|
NAV Graph |
|
|
|
|
|
|
|
|
|
|
|
|
|
|
|
|
|
|
|
Investment Details
|
|
Objective |
| To seek long term capital growth through investments made dynamically across market capitalization (i.e. Large, Mid, and Small Caps). The investment could be in any one, two or all three types of market capitalization. The Scheme aims to predominantly invest in equity and equity related securities. However, in line with the asset allocation pattern of the Scheme, it could move its assets between equity and fixed income securities depending on its view on these markets. However, there can be no assurance or guarantee that the investment objective of the scheme would be achieved. |
|
|
|
Min. Investment (Rs.)
|
5000 |
|
Increm.Investment (Rs.)
|
1000 |
|
|
|
Investment Pattern |
| Type | Minimum % | Maximum % | | Equities & Equity related securities | 65 | 100 | | Debt instruments & MMI (including Cash & Cash equivalent) | 0 | 35 | | Units issued by REITs and InvlTs | 0 | 10 |
|
|
|
|
SIP Details |
|
|
SIP MIN Investments(Rs.) |
500 |
|
SIP Incremental Investments(Rs.) |
1 |
|
SIP Frequency |
Daily |
|
No.of Investments Cheques
|
|
|
|
|
|
|
|
|
|
Ratios
|
|
Statistical Ratios |
|
|
|
Beta [%] |
1.0266
|
|
Sharpe Ratio [%] |
0.0144
|
|
R-Square [%] |
0.8834
|
|
Expense Ratio [%] |
0.0000
|
|
AVG Ratio [%] |
-0.0209
|
|
|
|
|
|
Other Ratios |
|
|
|
Treynor Ratio [%] |
0.0026
|
|
Turnover Ratio [%] |
0.4100
|
|
FAMA Ratio [%] |
0.0296
|
|
SORTINO Ratio [%] |
-0.0722
|
|
|
|
|

|
What is Standard Deviation?
Standard Deviation is the measure of the deviation in the returns of the portfolio. In Simple Words it tells us how much the return on the fund is deviating from the expected normal return.
|
|
|
What is Jenson's Alpha?
It measures whether the Scheme is generating excess returns over the normal returns.For example, if there are two mutual funds that both have a 12% return, a rational investor will want the fund that is less risky.If the value is positive, then the portfolio is earning excess returns. In other words, a positive value for Jensen's alpha means a fund manager has 'beat the market' w with his or her stock picking skills. The Higher the value the better the performance.
|
|
|
|
|
|
|
Portfolio Analysis
|
|
Allocations As on
31-May-2026
|
|
|
|
Fund Size :
5538.48
(Cr.) |
|
|
|
 |
|
 |
|
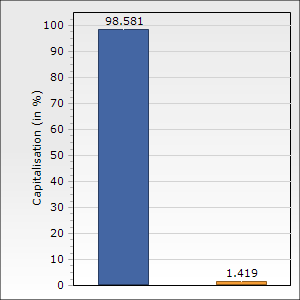
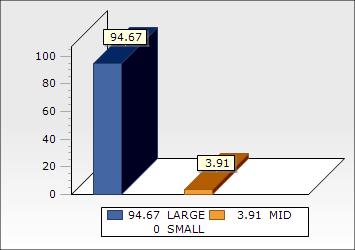
Market cap-wise Allocation Style |
|
|
|
Average Mkt Cap (Rs Cr) |
195826.26
|
|
Market Capitalization |
% of Portfolio
|
|
Large |
92.63
|
|
Mid |
5.56
|
|
Small |
NA
|
|
Note: Large-Cap = 5000 Crs. and above, Mid-Cap = 2000 Crs. to 5000 Crs. and
Small-Cap = less than 2000 Crs. |
|
|
|
|
|
|
Portfolio Concentration |
|
|
% Net Assets
|
|
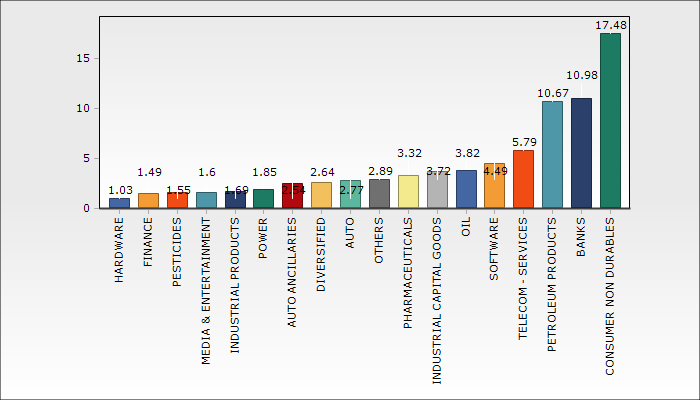
Top 3 Sectors |
39.13 |
|
|
|
+ - Top 5 Holdings |
15.19 |
| ICICI Bank | 4.20 | | HDFC Bank | 3.15 | | Reliance Industries | 2.85 | | MTAR Technologies | 2.73 | | TD Power Systems | 2.26 |
|
|
+ - Top 10 Holdings |
25.31 |
| ICICI Bank | 4.20 | | HDFC Bank | 3.15 | | Reliance Industries | 2.85 | | MTAR Technologies | 2.73 | | TD Power Systems | 2.26 | | Multi Commodity Exch | 2.10 | | State Bank Of India | 2.09 | | SamvardhanaMotherson | 2.01 | | Axis Bank | 1.96 | | Shriram Finance | 1.96 |
|
|
|
|
|
 ICICI Bank Ltd.
|
4.20
|
|
HDFC Bank Ltd.
|
3.15
|
|
Reliance Industries Ltd.
|
2.85
|
 MTAR Technologies Ltd.
|
2.73
|
|
TD Power Systems Ltd.
|
2.26
|
|
Multi Commodity Exchange Of India Ltd.
|
2.10
|
|
State Bank Of India
|
2.09
|
|
Samvardhana Motherson International Ltd.
|
2.01
|
|
Axis Bank Ltd.
|
1.96
|
|
Shriram Finance Ltd.
|
1.96
|
|
|
 Indicates an increase
or decrease or no change in holding since last portfolio Indicates an increase
or decrease or no change in holding since last portfolio
|
 Indicates a new
holding since last portfolio. Indicates a new
holding since last portfolio.
|
|
|
Detailed Portfolio |
|
|
|
|
Sector Allocation * (as % of equity portfolio) |
|
|
|
Sector Allocation
Chart Type : |
 |
|
*Pertains to the equity investments only. |
|
|
|
|
|
|
|
|
|
|
What's In / What's Out
|
| What's in as on 31-May-2026 |
What's out as on 31-May-2026 |
| Company Name | Mkt Value | Holdings | | (Rs.Cr) | % | | Bharat Heavy Electricals Ltd. | 41.3183 | 0.746 | | Jyoti CNC Automation Ltd. | 24.4724 | 0.4419 | | Atlanta Electricals Ltd. | 11.3177 | 0.2043 | | Billionbrains Garage Ventures Ltd. | 48.1872 | 0.87 |
|
| Company Name | Mkt Value | Holdings | | (Rs.Cr) | % | | Vikram Solar Ltd. | 33.3988 | 0.6179 | | Kaynes Technology India Ltd. | 57.2287 | 1.0588 | | Jubilant FoodWorks Ltd. | 34.9665 | 0.6469 |
|
|
|
|
|
|
|
|

