| 
                                            
                                         | 
                                    
                                    
                                        | 
                                         | 


        | 
         | 
     
    
        | 
            NAV Details
         | 


                    | 
                     | 
                 
                
                    | 
                        NAV Date
                     | 
                    27-Mar-20 | 
                    
                        Max Entry Load %
                     | 
                    0.00 | 
                 
                
                    | 
                        NAV [Rs] | 
                    106.80 | 
                    
                        Max Exit Load %
                     | 
                    0.00 | 
                 
                
                    | 
                        Buy/Resale Price [Rs]
                     | 
                    106.80 | 
                    
                        52 Week High[Rs] | 
                    
                        NA | 
                 
                
                    | 
                        Sell/Repurchase Price [Rs]
                     | 
                    106.80 | 
                    
                        52 Week Low[Rs]
                     | 
                    
                        NA | 
                 
             
         | 
     
 
                                                     | 


                                                                | 
                                                                    NAV Graph | 
                                                                
                                                                    
                                                                 | 
                                                             
                                                            
                                                                | 
                                                                 | 
                                                             
                                                            
                                                                | 
                                                                    
                                                                 | 
                                                                
                                                                    
                                                                 | 
                                                             
                                                            
                                                                | 
                                                                 | 
                                                             
                                                         
                                                     | 
                                                 
                                             
                                         | 
                                    
                                    
                                        | 
                                         | 
                                    
                                    
                                        | 
                                            
                                         | 
                                    
                                    
                                        | 
                                         | 


                                        | 
                                         | 
                                     
    
        | 
            Investment Details
         | 


                    | 
                        Objective | 
                 
                
                    | To achieve capital appreciation by investing in equity and equity related instruments. | 
                 
                 |  
                  |  
                
                    | 
                        Min. Investment (Rs.)
                     | 
                    3000 | 
                 
                
                    | 
                        Increm.Investment (Rs.)
                     | 
                    500 | 
                 
             
         | 
         | 


                                | 
                                    Investment Pattern | 
                             
                            
                                | Type | Minimum % | Maximum % |  | Equity | 80 | 100 |  | MMI | 0 | 20 |  | Others | 0 | 20 |  | Debt | 0 | 20 |  
  | 
                             
                         
                     | 
                 
                 |  


                                | 
                                    SIP Details | 
                             
                             |  
                            
                                | 
                                    SIP MIN Investments(Rs.) | 
                                
                                    NA | 
                             
                            
                                | 
                                    SIP Incremental Investments(Rs.) | 
                                
                                    NA | 
                             
                            
                                | 
                                    SIP Frequency   | 
                                
                                    NA | 
                             
                            
                                | 
                                    No.of Investments Cheques
                                 | 
                                
                                    NA | 
                             
                         
                     | 
                 
             
         | 
     
 
                                         | 
                                    
                                    
                                        | 
                                         | 


        | 
         | 
     
    
        | 
            Ratios
         | 


                    | 
                        Statistical Ratios | 
                 
                
                    | 
                     | 


                                        | 
                                            Beta [%] | 
                                        
                                            
                                                0.7422
                                            
                                         | 
                                     
                                    
                                        | 
                                            Sharpe Ratio [%] | 
                                        
                                            
                                                -0.4925
                                            
                                         | 
                                     
                                    
                                        | 
                                            R-Square [%] | 
                                        
                                            
                                                0.8946
                                            
                                         | 
                                     
                                    
                                        | 
                                            Expense Ratio [%] | 
                                        
                                            
                                                2.2900
                                            
                                         | 
                                     
                                    
                                        | 
                                            AVG Ratio [%] | 
                                        
                                            
                                                -0.0783
                                            
                                         | 


                     | 


                    | 
                     | 
                 
                
                    | 
                        Other Ratios | 
                 
                
                    | 
                     | 


                                        | 
                                            Treynor Ratio [%] | 
                                        
                                            
                                                -0.1838
                                            
                                         | 
                                     
                                    
                                        | 
                                            Turnover Ratio [%] | 
                                        
                                            
                                                0.0200
                                            
                                         | 
                                     
                                     
                                        | 
                                            FAMA Ratio [%] | 
                                        
                                            
                                                -0.0731
                                            
                                         | 
                                     
                                     
                                        | 
                                            SORTINO Ratio [%] | 
                                        
                                            
                                                -0.1256
                                            
                                         | 


                     | 


         | 
        
         | 


                     | 
                    
                 What is Standard Deviation? Standard Deviation is the measure of the deviation in the returns of the portfolio. In Simple Words it tells us how much  the return on the fund is deviating from the expected normal return.
                     | 


                     | 
                    
                    What is Jenson's Alpha? It measures whether the Scheme is generating excess returns over the normal returns.For example, if there are two mutual funds that both have a 12% return, a rational investor will want the fund that is less risky.If the value is positive, then the portfolio is earning excess returns. In other words, a positive value for Jensen's alpha means a fund manager has 'beat the market' w with his or her stock picking skills. The Higher the value the better the performance.
                     | 
                 
             
         | 
     
     |  
 
                                         | 
                                    
                                    
                                        | 
                                         | 


                                                    | 
                                                        Portfolio Analysis
                                                     | 


                                                                | 
                                                                    Allocations As on
                                                                    29-Feb-2020
                                                                 | 
                                                             
                                                            
                                                                | 
                                                                 | 
                                                             
                                                            
                                                                | 
                                                                    Fund Size :
                                                                        3.59
                                                                        (Cr.) | 
                                                                
                                                                     | 
                                                             
                                                            
                                                                | 
                                                                 | 


                                                                      | 
                                                             
                                                         
                                                     | 


                                                                      | 
                                                             
                                                            
                                                                | 
                                                                    Market cap-wise Allocation Style | 
                                                             
                                                            
                                                                | 
                                                                 | 
                                                             
                                                            
                                                                | 
                                                                    Average Mkt Cap (Rs Cr) | 
                                                                
                                                                    309004.61
                                                                 | 
                                                             
                                                            
                                                                | 
                                                                    Market Capitalization | 
                                                                
                                                                    % of Portfolio
                                                                 | 
                                                             
                                                            
                                                                | 
                                                                    Large | 
                                                                
                                                                    98.58
                                                                 | 
                                                             
                                                            
                                                                | 
                                                                    Mid | 
                                                                
                                                                    NA
                                                                 | 
                                                             
                                                            
                                                                | 
                                                                    Small | 
                                                                
                                                                    NA
                                                                 | 
                                                             
                                                            
                                                                | 
                                                                    Note: Large-Cap = 5000 Crs. and above, Mid-Cap = 2000 Crs. to 5000 Crs. and
                                                                    Small-Cap = less than 2000 Crs. | 
                                                             
                                                         
                                                     | 
                                                 
                                                
                                                    | 
                                                     | 


                                        | 
                                         | 
                                     
    
        | 
            Portfolio Concentration | 
     
    
        | 
              | 
        
            % Net Assets
         | 


                    | 
                        Top 3 Sectors | 
                    34.79 | 
                 
                
                    | 
                     | 
                 
                
                    | 
                        +  -  Top 5 Holdings | 
                    35.00 | 
                 
                
                    | ICICI Bank | 9.79 |  | Reliance Industries | 7.86 |  | HDFC Bank | 7.16 |  | Bata india | 5.13 |  | Axis Bank | 5.06 |  
  | 
                 
                
                    | 
                        +  -  Top 10 Holdings | 
                     56.46 | 
                 
                
                    | ICICI Bank | 9.79 |  | Reliance Industries | 7.86 |  | HDFC Bank | 7.16 |  | Bata india | 5.13 |  | Axis Bank | 5.06 |  | SBI | 4.95 |  | Ipca Laboratories | 4.46 |  | Atul | 4.35 |  | PI Industries | 4.23 |  | Indusind Bank | 3.46 |  
  | 
                 
             
         | 


                                                     | 
                                                 
                                                
                                                    | 
                                                     | 


                            ICICI Bank Ltd.
                         | 
                            9.79
                         | 


                            Reliance Industries Ltd.
                         | 
                            7.86
                         | 


                            HDFC Bank Ltd.
                         | 
                            7.16
                         | 


                            Bata India Ltd.
                         | 
                            5.13
                         | 


                            Axis Bank Ltd.
                         | 
                            5.06
                         | 


                            State Bank Of India
                         | 
                            4.95
                         | 


                            Ipca Laboratories Ltd.
                         | 
                            4.46
                         | 


                            Atul Ltd.
                         | 
                            4.35
                         | 


                            PI Industries Ltd.
                         | 
                            4.23
                         | 


                            IndusInd Bank Ltd.
                         | 
                            3.46
                         | 


         | 
     
    
         | 


                   Indicates an increase
            or decrease or no change in holding since last portfolio
         | 


              Indicates a new
            holding since last portfolio.
         | 
     
    
        | 
         | 


                Detailed Portfolio | 
     
 
                                                     | 
                                                 
                                                
                                                    | 
                                                     | 
                                                 
                                                
                                                    | 
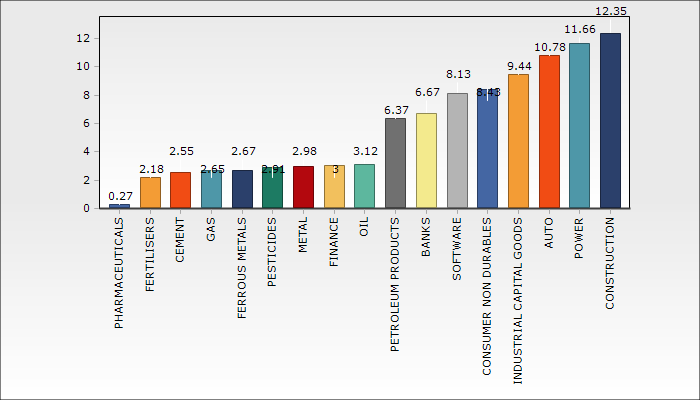
                                                        Sector Allocation * (as % of equity portfolio) | 
                                                 
                                                
                                                    | 
                                                     | 
                                                 
                                                
                                                    | 
                                                        Sector Allocation  
                                                          Chart Type :  | 


                                                          | 
                                                 
                                                
                                                    | 
                                                        *Pertains to the equity investments only. | 
                                                 
                                                
                                                    | 
                                                     | 
                                                 
                                             
                                         | 
                                    
                                    
                                        | 
                                         | 
                                    
                                    
                                        | 
                                            
                                         | 
                                    
                                    
                                        | 
                                         | 


        | 
           What's In / What's Out
         | 
     
     | What's in as on  | 
     What's out as on  | 
 
| Company Name | Mkt Value | Holdings |   | (Rs.Cr) | % |  | No Data Found |  
  | 
| Company Name | Mkt Value | Holdings |   | (Rs.Cr) | % |  | No Data Found |  
  | 
 | 
 
 |  
 
                                         | 
                                    
                                    
                                        | 
                                         | 
                                    
                                    
                                        | 
                                         |